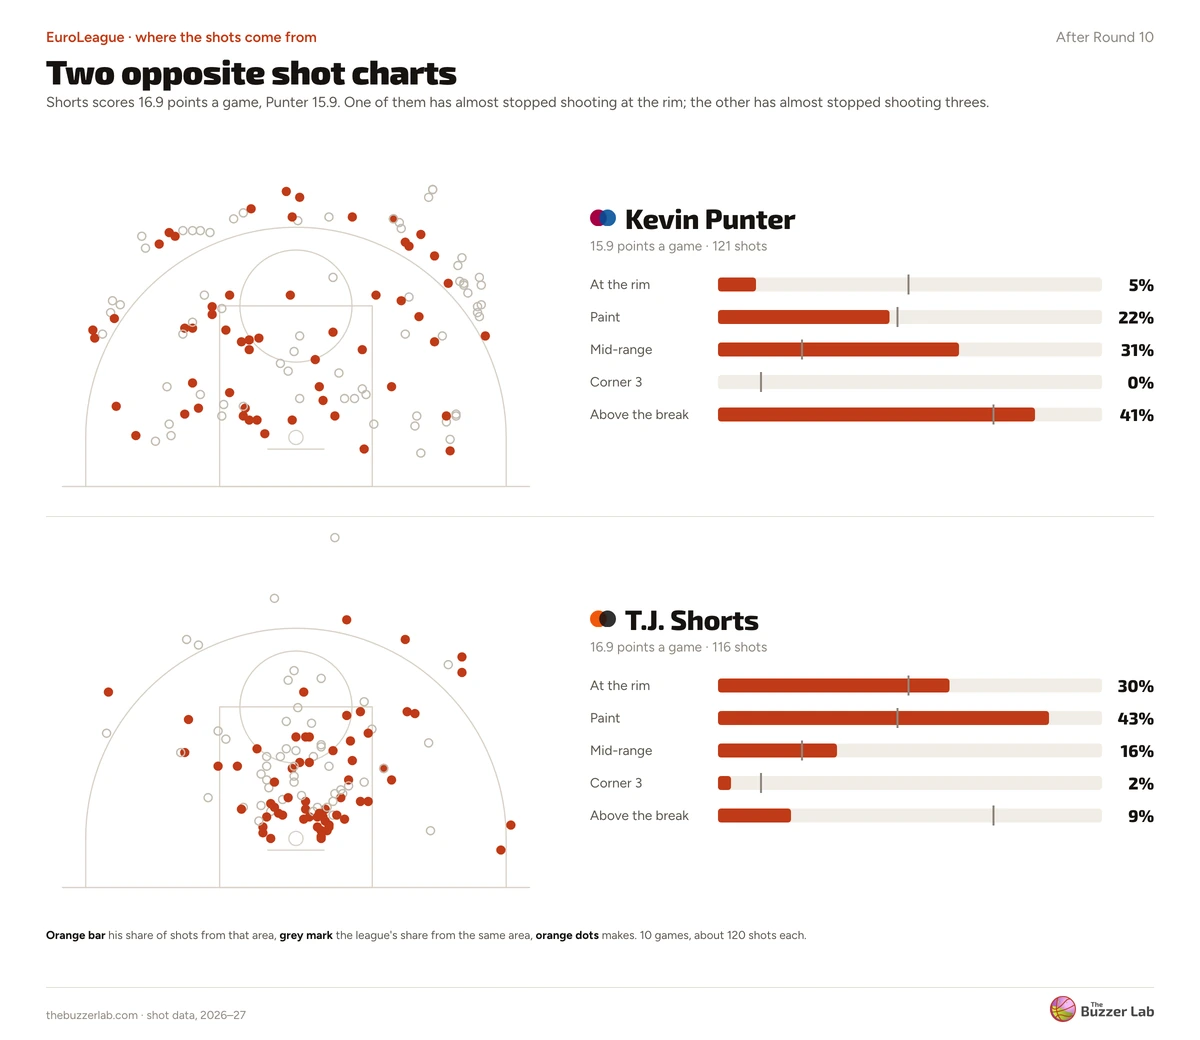
Kevin Punter is scoring 16.7 points a game. T.J. Shorts is scoring 17.1. Same position, similar load, and almost nothing in common about where the points come from.
We took every shot attempted in the league this season, 11,820 of them, and sorted each one into five areas: at the rim, the rest of the paint, mid-range, corner threes and threes above the break. That gives a league baseline, and a way to read one player's shot chart against it.
Kevin Punter shoots from the place everyone else gave up
The league takes 10.9% of its shots from mid-range. Punter takes 31.2% of his there. Of the 99 players who have taken at least 50 shots this season, only two take a bigger share.
He makes them, too: 52.9% from mid-range, against a league mark of 41.5%.
The other end of his chart is nearly empty. Punter has taken six shots at the rim this season. Six, out of 109. For the league, the rim is 24.6% of all shots.
So the reading is a guard who rises into a pull-up from fifteen feet instead of driving into a crowd, and a Barcelona offence built to give him that shot.
T.J. Shorts has the shot chart of a centre
Shorts takes 73% of his shots at the rim or in the paint. His three-point rate is 10.7%.
Among those same 99 players, every man who shoots fewer threes than him is a centre. Shorts is 175cm tall.
It is working. He finishes 75.8% at the rim, a little above the league's 73.2%, and he is handing out 5.7 assists a game for Valencia. The threes he does take are dropping at 54.5%, but that is 11 attempts, which means nothing yet.
Opposite routes, same efficiency
Here is the part that makes the pair worth putting side by side. Punter's True Shooting is 61.4%. Shorts' is 62.3%. Two guards who agree on nothing about where to shoot from finish within a point of each other.
The routes differ underneath as well. Punter's extra value comes from volume behind the arc. Shorts gets his at the line: he takes 45.6 free throws per 100 shots, against Punter's 27.5.
One caution, because it matters at this point of the season. These are nine games and about 100 shots each. Punter's mid-range share rests on 34 attempts, so the percentage will move around for a while. The mix moves much less than the percentage, and the mix is the part that describes the player. The same map sits on every player page here, and it updates after each round.